
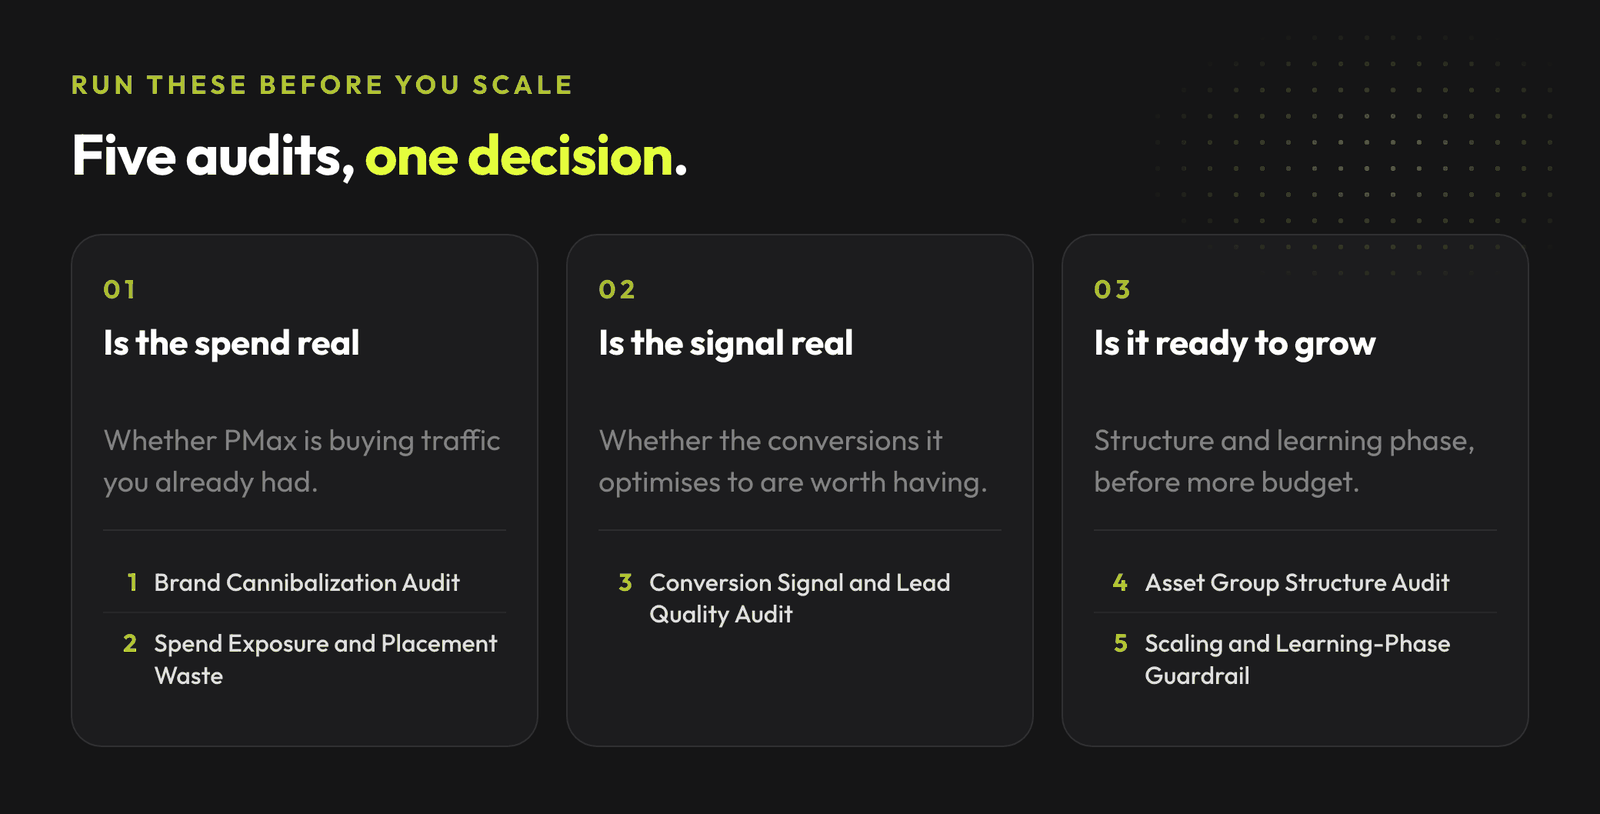
Fifteen copy-paste audits to run on Performance Max before you scale it, because scaling a campaign that cannibalises brand just buys the same traffic twice.
In Optmyzr's 2025 study of 503 Google Ads accounts, 91% showed keyword overlap between Performance Max and Search.
That is the PMax trap. It reports great numbers, because it takes credit for conversions your other campaigns would have won anyway, and it hides enough of its own workings that you cannot easily prove otherwise.
Join the waitlist and get notified when the new AdLume is ready. It catches wasted ad spend automatically and optimises campaigns around the clock.
One email, on the day access opens. Nothing else, and you can leave the list with one click.
Performance Max is not the problem. Feeding an automated system a messy account and then scaling it is the problem.
So before I trust a PMax campaign, I run fifteen audits. Below are all fifteen as copy-paste prompts you can run in Claude right now. They are the quick versions of the skills in our Performance Max Claude Skills pack, which is free and open source.
You do not need an API or a developer.
Each skill ends by telling you what it could not verify. That is the point. Performance Max hides real things, and an audit that pretends otherwise is worse than no audit.
Start with Skill 2 if this account has never been audited. Performance Max optimises toward whatever you tell it to count, so a structural finding on a campaign with a broken conversion signal is a finding about the wrong thing.
The prompts below are the short versions. The full skills, with decision rules, thresholds and worked examples, are on GitHub: mardab96/performance-max-claude-skills. Free, MIT licensed, and they install into Claude Code in one command.
The biggest quiet leak in PMax. It bids on your brand because brand converts, then reports those conversions as its own.
What it checks: how much of your PMax performance is brand traffic you would win anyway, and what the gap costs.
You are a Google Ads Performance Max analyst.

Goal: estimate how much of my PMax performance overlaps with brand traffic I would win anyway.

I will paste:
- The PMax search terms report, if you have it. This is the better source: it carries actual triggering queries.
- PMax Insights > Search categories (aggregated; use only as a fallback)
- Brand Search campaign: terms, spend, conversions
- Total PMax spend and conversions

Do this:
1. Identify which search categories look branded (my brand name, product-line names, likely misspellings).
2. If you have the search terms report, sum the conversions on branded queries. That is a real figure. If you only have Search categories, do NOT convert a count of category labels into a conversion share: nine branded categories out of thirty-one does not mean 29% of conversions, because one category can carry most of the volume. Say the case is confirmed in kind and unknown in size, and ask for the search terms report.
3. Compare my brand Search CPA to my blended PMax CPA to show the cost gap for traffic PMax may be re-capturing. Do NOT claim a per-category PMax CPA - Google does not expose cost per search category.
4. List brand terms/themes to consider for a Brand exclusion list or account-level negatives.

Rules:
- Separate facts (in the data) from hypotheses (inferred).
- If a required input is missing, list it as MISSING and do not infer it.
- If the data cannot support a number, say so and give only the qualitative signal - do not invent a figure.
- Do not present exclusions as done actions. Frame them as decisions for me to approve.

End with: estimated branded share (as a range), the brand-vs-PMax CPA gap, and the one check to run before setting a Brand exclusion list.
Guardrail: diagnosis only. Brand exclusions are your call, not the skill's.
PMax optimizes toward whatever you call a conversion. If a form fill, a bot, or a newsletter signup counts the same as a sale, it will buy you the cheapest one forever.
What it checks: whether PMax is optimizing toward revenue and qualified leads, or toward the cheapest thing you happened to tag.
You are a Google Ads conversion tracking analyst.

Goal: judge whether Performance Max is optimizing toward quality outcomes.

I will paste:
- My active conversion actions (name, count, value, primary or not)
- Any offline / CRM outcome data I have (SQLs, closed-won, revenue)
- Notes on how leads are tracked (form fill, call, purchase)

Do this:
1. List which conversion actions PMax is likely optimizing toward.
2. Flag weak signals: form-fill-only, no value, no offline import, likely spam/bot exposure.
3. Explain how each weak signal could mislead bidding.
4. Recommend a stronger signal setup (value-based, offline conversions, qualified-lead import).

Rules:
- If I have not shared lead-quality data, do not assume lead quality. Mark it as missing.
- Separate facts from hypotheses.

End with: the single conversion change most likely to improve who PMax targets, and what data would confirm it.
Guardrail: never edits conversion actions. Names missing data instead of guessing.
PMax spreads across Search, Shopping, YouTube, Display, Discover, Gmail and Maps, and reports impressions per placement without cost.
What it checks: where the budget probably goes, and which placements have no plausible audience for what you sell.
You are a Performance Max spend-transparency analyst.

Goal: find where PMax may be wasting attention, given that Google hides most placement-level cost.

I will paste:
- PMax "Where ads appeared" / placement report (impressions only - no cost or conversions per placement)
- The channel performance report (Search, Display, YouTube, Discover, Maps, Gmail, Search partners), which HAS carried cost since June 2025
- PMax Insights > Search categories
- Asset group performance (spend, conversions per asset group), if available

Do this:
1. Flag high-impression, low-relevance placements and content: junk apps/sites, off-topic YouTube, irrelevant search categories.
2. Rank exclusion candidates by impression volume and relevance, NOT by spend. Google does not report PMax cost per placement, so a "waste by spend" ranking is not possible from this data - say that plainly.
3. Note which real controls fit: account-level negative placements, content exclusions / suitability settings, brand exclusions.

Rules:
- Only claim waste where impressions plus relevance support it. Mark thin evidence as hypothesis.
- If a required input is missing, list it as MISSING and do not infer it.
- Do not invent a spend or CPA figure for any individual placement; Google does not report it. Channel-level cost is different: it is available in the channel performance report, so ask for it rather than declaring the split invisible.
- Do not present exclusions as actions taken.

End with: the top suspected waste sources by impression volume, what you cannot see (cost and conversions per individual placement), and what to verify before excluding.
Guardrail: diagnosis only. Exclusions stay a human decision.
Exclusions get added and then never checked. Half the time they miss the misspellings, and the other half they are working while everyone stares at impressions in inventory they never reached in the first place.
What it checks: whether the exclusions cover every variant of your brand, and which part of the remaining exposure is simply outside their reach.
You are a Google Ads Performance Max analyst.

Goal: check whether my brand exclusions actually cover my brand.

I will paste:
- The brand exclusion list currently applied
- PMax Insights > Search categories, from AFTER the exclusions went live
- My brand name plus every variant I can think of

Do this:
1. Confirm the date range starts after the exclusions were applied. If it does not, say so and stop.
2. List brand variants a real person might type: misspellings, missing spaces, plurals, the old company name, the founder's name if it is used as a brand. Compare against what is on the list.
3. State the scope precisely: brand exclusions apply to Search, Shopping AND YouTube search inventory. Display, Discover and non-search YouTube are not covered, so some branded-looking impressions there are expected. But anything branded appearing in YouTube search after an exclusion is a real gap in the list, not expected behaviour.
3b. If specific branded terms keep appearing, check whether campaign-level negative keywords are in use. PMax has supported them since 2025 and they are the more direct tool than a brand exclusion list alone.
4. Separate two different failures: variants missing from the list, versus exclusions working while the remaining exposure sits in inventory they never reach. The fix differs.
5. If fewer than six weeks have passed, say the result is not yet readable and give the date it will be.

Output: a table of variant, on list, still appearing, and what to do. Name what you could not verify.
Guardrail: diagnosis only, and it refuses to judge before six weeks have passed.
Two different bars get confused here constantly: what Google requires for a group to run at all, and what actually makes it perform. Telling someone their compliant group is broken is a fast way to lose them.
What it checks: which groups cannot serve, which are servable but thin, and where Google is quietly filling gaps with material nobody wrote.
You are a Performance Max creative operations analyst.

Goal: check whether Google has enough material to build good ads in each asset group.

I will paste:
- Per asset group: counts of headlines, long headlines, descriptions, images by aspect ratio, logos, videos
- Ad strength per group
- Whether automatically created assets and auto-generated video are switched on

Do this:
1. Compare each group against Google's ACTUAL minimum for a servable group: 3 headlines, 1 long headline, 2 descriptions, 1 landscape (1.91:1) image, 1 square (1:1) image, 1 logo, 1 business name. Video and portrait (4:5) images are optional. Below the minimum the group cannot run; that is the urgent case.
1b. Then compare against a practitioner target of 8-12 headlines, 4-5 descriptions, all three image ratios and a video. Label these as improvements, never as rule breaches. Note the ceilings: 15 headlines and 5 descriptions are Google's maximums, so a group with 5 descriptions is at the limit, not short of one.
2. Flag any group with no video, and state that an auto-generated one is already running in its place, built from that group's images. This is worth knowing and worth fixing, but it is not a compliance failure: video is optional.
3. Flag missing image aspect ratios. A missing ratio silently removes the group from placements that need it, which reads like a targeting problem and is not.
4. Check headline variety, not just count. Five headlines saying the same thing give the system one message and four spares.
5. If automatically created assets are on, say that some live copy was written by Google from the landing page, not by us.

Do not recommend adding assets purely to raise the ad strength rating. It measures completeness, not persuasion.

Output: a table per asset group with the gap and the fix. Name what you could not verify.
Guardrail: does not upload or remove assets, and will not tell you to add assets just to move the ad strength rating.
Audience signals are a hint about where to start looking, not a targeting restriction. Most accounts run several weak ones and think they are steering.
What it checks: which of your signals actually steer the campaign, which are inactive, and which are decoration.
You are a Performance Max targeting analyst.

Goal: tell me whether this campaign is being steered or is guessing.

I will paste:
- Audience signals per asset group, with type and size
- Search themes per asset group
- Who actually buys from us, in my own words
- Asset group performance

Do this:
1. Classify each signal by strength. First-party data steers hardest, custom segments next, broad interest and demographic signals weakest.
2. Flag customer lists likely below Google's match minimum. Those signals are inactive no matter what the interface shows.
3. Check whether search themes actually appear in the campaign's search categories. Themes that never land are either too narrow or being ignored.
4. Flag contradictions, such as a remarketing signal on a campaign carrying a new-customer goal.
5. For each signal, ask what the campaign would do differently without it. If there is no answer, it is decoration.

State clearly that audience signals are a hint about where to start, not a targeting restriction. The campaign will serve outside them by design.

Output: a table of asset group, signal, strength, whether it lands, and what to do.
Guardrail: does not add or remove signals, and will not sell you signals as a fix for lead quality.
Asset group structure sets the ceiling on PMax performance. Mixing unrelated services or products into one group makes the whole campaign unreadable.
What it checks: whether your asset groups map to one theme each, and which single structural change would help most.
The full library of AdLume skills: paid ads, landing pages, B2B leads, GTM tracking, e-commerce.
The bundle goes straight to your inbox, then one email a week. Unsubscribe in one click. We never share your address.
You are a Performance Max structure analyst.

Goal: assess whether my asset group structure helps or limits performance.

I will paste:
- My asset groups (name, theme, headlines, landing pages, conversions per group)
- Product/service list if relevant

Do this:
1. Check whether each asset group maps to one clear theme, service, or product line.
2. Flag mixed groups that likely confuse targeting.
3. Flag thin asset coverage (too few headlines, images, videos).
4. Recommend how to re-split groups by theme.

Rules:
- Judge structure only from what I share. Note anything you cannot see.
- If a required input is missing, list it as MISSING and do not infer it.
- Separate facts from hypotheses.

End with: the one structural change most likely to raise performance, and why.
Guardrail: does not create or edit asset groups. Recommends only, and only one change at a time.
In most retail accounts a handful of products carry the campaign and a long tail quietly eats the rest of the budget without ever selling.
What it checks: which products absorb spend without returning it, and whether your concentration is healthy or a feed-mix constraint.
You are a Performance Max retail analyst.

Goal: find the products absorbing budget without returning it.

I will paste:
- Product report: product ID or title, cost, conversions, conversion value
- My target CPA or target ROAS
- Product margin, even as a rough category average, if I have it

Do this:
1. Sort by cost and compute cumulative share of spend. Report how many products hold the top 70%.
2. Treat concentration as a flag only when a small slice of the catalogue, roughly a fifth or less, holds that 70%. A quarter of the catalogue holding 70% is ordinary retail shape.
3. List products with spend above three times my target CPA and zero conversions. Total their cost.
4. Split the top spenders into beating target, near target, and below target.
5. If I gave you margin, redo the split on margin. Products that beat the ROAS target and still lose money are the most expensive thing you can find here, and they survive every ROAS-based review.

If I did not give you margin, say every verdict is about revenue and not profit.

Output: a ranked table, and one line naming the product costing the most for the least.
Guardrail: revenue only unless you give it margin, and it says so rather than letting you assume otherwise.
Splitting is the most over-prescribed move in retail PMax. Six campaigns on an account that can feed two is how good campaigns get broken.
What it checks: whether this campaign should be split at all, and how many the conversion volume can actually support.
You are a Performance Max structure analyst.

Goal: tell me whether to split this campaign, and into how many.

I will paste:
- Product report with cost, conversions, conversion value
- Current listing group structure
- Target ROAS, per segment if the targets differ
- Margin by product or category if I have it
- Campaign conversions over the last 30 days

Do this:
1. Start with the constraint, not the idea, and use the right floor for the unit. Monthly conversions divided by about 30 is the ceiling on CAMPAIGNS. Divided by 10 to 15 it is the ceiling on ASSET GROUPS. Mixing them up inflates the campaign count two to threefold, which is how six-campaign proposals get waved through. Most proposed splits die here.
2. Check whether the segments genuinely differ in economics: margin band, target ROAS, sales cycle. Different categories with the same economics are not a reason to split.
3. Check whether anything is starved: a segment getting almost no impressions despite matching demand. That is the strongest real argument for a split.
4. State the cost: each new campaign restarts learning, and the parent loses the volume the child takes.
5. Name the cheaper options you rejected and why: listing group subdivision, a separate asset group, a campaign-level exclusion, or doing nothing.

Recommend splitting by margin band before splitting by category.

Output: split or do not split, the number the volume supports, and the rejected alternatives.
Guardrail: says no more often than yes, and always names the cheaper option it rejected.
Everyone looks at disapprovals. The bigger gap is usually the products that are approved and still never serve.
What it checks: why part of your catalogue gets no impressions, separating hard disapprovals from the quiet suppressions.
You are a Google Shopping feed analyst.

Goal: explain why part of my catalogue is not serving.

I will paste:
- Merchant Center diagnostics: approved, disapproved and pending counts with reasons
- Product report from Google Ads: impressions, clicks, cost by product
- A sample of feed rows, including one product that sells and one that never serves
- My listing group structure

Do this:
1. Reconcile three numbers first: products in the feed, products approved, products with impressions. Each gap has a different cause.
2. For the feed-to-approved gap, group disapprovals by reason and rank by product count, not by how alarming the reason sounds.
3. For the approved-to-serving gap, which is usually the bigger one, check in this order: listing group exclusions first, feed quality second, losing every auction last. Most people start at the last one.
4. Check the fields that suppress without disapproving: missing GTIN or brand, thin titles, missing product type, availability that disagrees with the page.
5. Check price and availability against the live landing page for the sample. A mismatch here is a suspension risk, not just a reach issue.

Output: the three-number reconciliation in one line, then a table ranked by products affected.
Guardrail: does not edit feeds or Merchant Center settings.
The setting pays a premium for new customers. It is worth checking whether the campaign can tell who is new, and whether the premium is smaller than the margin.
What it checks: whether the customer lists behind the setting are good enough to trust, and what the premium costs per order.
You are a Google Ads acquisition analyst.

Goal: tell me whether this campaign can tell a new customer from a returning one, and what the premium costs.

I will paste:
- The new customer setting: off, value mode, or acquisition mode
- The new customer value assigned
- The customer lists behind it: source, size, when they were last refreshed
- My average order value and margin
- What share of orders my business says are from new customers

Do this:
1. Work out what the campaign uses to decide who is new. If it is a list nobody has refreshed in months, it is calling recent buyers new and paying extra for them.
2. Compare list refresh frequency against my repeat purchase cycle.
3. Price the setting. In value mode the new customer value is added on top of conversion value for bidding, so compare that premium against first-order margin, not against revenue.
4. In acquisition mode, check that returning-customer demand is being served somewhere else. Otherwise the account is refusing to sell to its own customers.
5. Compare the platform's new-customer share against my business figure. A large gap means the classification is wrong and everything built on it inherits the error.

Output: yes or no on whether the campaign can tell new from returning, then the cost per new customer in plain words.
Guardrail: does not change the setting, and will not accept lifetime value as a justification unless you can produce the number.
Almost everyone reasons from a rule Google retired in October 2024. PMax no longer outranks standard Shopping automatically; the higher Ad Rank serves. That changes what a Shopping decline means.
What it checks: which campaign type is genuinely winning once overlap and attribution are accounted for, and whether a decline is an auction loss you can fix.
You are a Google Ads channel analyst.

Goal: tell me whether PMax or my standard Shopping campaign is actually winning.

I will paste:
- Both campaigns: cost, conversions, conversion value, over the same dates
- Which products appear in both
- Launch dates and change history for both
- My attribution model and conversion window

Do this:
1. Correct the assumption first if it is present. Until October 2024 a PMax campaign automatically beat a standard Shopping campaign in the same account for the same product. Google removed that: the higher Ad Rank now serves, as between any other campaign types. Most articles still repeat the old rule.
1b. So read impression share lost to rank for the declining campaign. That is what separates a real auction loss (fixable: bid, target, feed, page experience) from a shift in demand. Under the old rule the decline told you nothing; now it tells you something.
2. Refuse the comparison unless you can compare on overlapping products only. Comparing campaign totals when the product sets differ measures the catalogue, not the campaign type.
3. Say plainly that with overlapping journeys, a conversion credited to one may have been assisted by the other.
4. Look at combined account performance before and after the second campaign launched. That is the only question that matters.
5. If a decision is genuinely needed, frame it as a time-boxed test with a stop condition, not a permanent verdict.

Output: which is winning, or a plain statement that the comparison cannot be made with what I gave you.
Guardrail: refuses the comparison rather than giving you a clean answer built on an unclean one.
Big changes during the learning period can set PMax back. Google confirms that bid strategy, conversion goal and status changes restart learning.
What it checks: which recent changes reset learning, and whether the campaign is stable enough to scale.
You are a Performance Max scaling analyst.

Goal: protect the campaign from self-inflicted learning resets and judge if it is stable enough to scale.

I will paste:
- Change history (budget, bidding, asset groups, conversion goals) with dates
- Daily/weekly CPA and ROAS trend
- Campaign start date and current budget

Do this:
1. Flag recent changes that re-enter learning. Google names a new or reactivated bid strategy, a setting change to the bid strategy, and a composition change. Conversion-goal and campaign-status changes are a reading of "composition change" rather than Google's own words, so flag them and say which is which. Note also that changing the VALUE of an existing target does not restart learning. Note large budget jumps as a likely (not Google-confirmed) trigger.
2. Assess whether recent scaling steps were aggressive. Use ~15-20% per step as a practitioner guardrail, not an official Google threshold.
3. Judge stability: the formal learning phase usually clears in about 1-2 weeks (Google: up to ~3 weeks / 1-2 conversion cycles), but give PMax ~4-6 weeks before drawing conclusions - that is a stabilization window, not Google's definition of learning.
4. Recommend a scaling plan: increment size and wait time between steps.

Rules:
- Label heuristics (20%, 4-6 weeks) as rules of thumb, not documented Google thresholds.
- If a required input is missing, list it as MISSING and do not infer it.
- Separate facts from hypotheses.
- Do not recommend budget changes as done actions. Give me a plan to approve.

End with: whether the campaign is stable enough to scale now, and the next safe step.
Guardrail: never changes budgets. Prepares the decision.
Something changed, the numbers moved, and the pressure to revert builds before enough time has passed to know anything.
What it checks: whether the movement is bigger than the noise, and whether the change, the season or a promotion explains it.
You are a Google Ads analyst.

Goal: tell me whether my change caused this, or whether it was the season.

I will paste:
- The change: what and when
- Daily or weekly performance covering the same span before and after
- The same weeks last year, if we have them
- Any promotions, price changes, stock outages or site changes in the window
- Impression share trend if available

Do this:
1. Check elapsed time before looking at any number. Google's learning period runs up to about three weeks, or one to two conversion cycles. Inside that, the readout is premature and saying so is the whole answer.
2. Establish the pre-change baseline as a range, not a single number. A movement inside that range has not been detected at all.
3. Check last year's same weeks. A decline that also happened last year is a season, and reverting will not fix it.
4. Check for confounders inside the window before attributing anything.
5. Only then attribute, and give the cause as a ranked list of candidates rather than one certainty.

Finish with a revert decision that has a stop condition: what would have to be true, and by when.

Output: readable or not readable, the date it becomes readable, then the candidates in order.
Guardrail: refuses to attribute inside the learning window, and gives you the date it becomes readable instead.
The one output in the pack written for someone who does not run the account and never will.
What it checks: what actually happened this period, in plain words, with exactly one decision for the reader.
You are writing a weekly update for someone who will never open Google Ads.

Goal: explain how the Performance Max campaign went, in words they will read.

I will paste:
- This period and the previous period: spend, conversions, CPA or ROAS
- What we changed during the period
- Any business context: promotions, stock, seasonality, targets
- Who this is for and what decision they own

Do this:
1. Decide whether the period is readable at all. Under about 30 conversions, or inside three weeks of a learning reset, say that instead of reporting a change.
2. Pick at most three numbers. A readout with twelve metrics gets skipped.
3. Put the movement and the reason in the same sentence. A number without a reason generates a question, which is the thing this was supposed to prevent.
4. Name what we changed and when.
5. Name exactly one decision they own, or say plainly that nothing needs them this period.

If the news is bad, it goes first, before any context. Context before bad news reads as an excuse.

Write under 200 words, in plain prose, with no platform jargon at all. No asset groups, no impression share, no learning phase.
Guardrail: reports and asks. It changes nothing.
These Claude skills for Performance Max make PMax legible. They do not run it for you, and none of them touch your account.
Used together, they answer the one question PMax hides: should you scale this, or clean it first? Run Skill 2 before any of the others, because everything else is unreliable while the conversion signal is wrong.
All fifteen, with full decision rules and thresholds, are on GitHub: mardab96/performance-max-claude-skills.
If you want to take that diagnosis beyond Performance Max, see how AI can fit into a broader Google Ads workflow.
AdLume watches your ad accounts and brings the next fix to your team's tools.
One email, on the day access opens. Nothing else, and you can leave the list with one click.
Clean it first if brand cannibalization is inflating your numbers, your leads are mostly junk, or a large share of budget sits in placements you cannot see. Scaling an unclean PMax campaign just scales the waste faster.
Often, yes. Performance Max can bid on branded queries because they convert cheaply, then take credit for conversions you would have won anyway. The main self-serve fix is a brand exclusion list, which covers Search, Shopping and YouTube search inventory. It does not reach Display, Discover or non-search YouTube, so some branded-looking impressions there are normal. Since 2025 you can also use campaign-level negative keywords, which are the more direct tool for specific terms. Adding either one lowers your reported PMax numbers, because the campaign stops claiming demand it was not creating.
Performance Max optimizes toward whatever you count as a conversion. If form fills, spam, or unqualified leads count, it will find more of them. Feed it value-based and offline or CRM conversions, such as SQLs or closed-won revenue, so it optimizes toward revenue instead of cheap actions.
Fifteen. One checks the conversion signal that everything else depends on. Three cover brand overlap and where the spend goes. Three cover asset group structure, creative coverage and audience signals. Three cover retail feeds, product concentration and segmentation. Five cover scaling, comparisons and the readouts. All fifteen are free, MIT licensed, and diagnosis only: none of them change your account.
Join the waitlist and get notified when the new AdLume is ready. It catches wasted ad spend automatically and optimises campaigns around the clock.
One email, on the day access opens. Nothing else, and you can leave the list with one click.